
 EN
EN
 ar
ar bg
bg hr
hr cs
cs da
da nl
nl fi
fi fr
fr de
de el
el hi
hi it
it ko
ko no
no pl
pl pt
pt ro
ro ru
ru es
es sv
sv tl
tl iw
iw id
id lv
lv lt
lt sr
sr sk
sk sl
sl uk
uk vi
vi et
et hu
hu th
th tr
tr fa
fa ms
ms hy
hy ka
ka ur
ur bn
bn mn
mn ta
ta kk
kk uz
uz ku
ku
Temperature Sensor
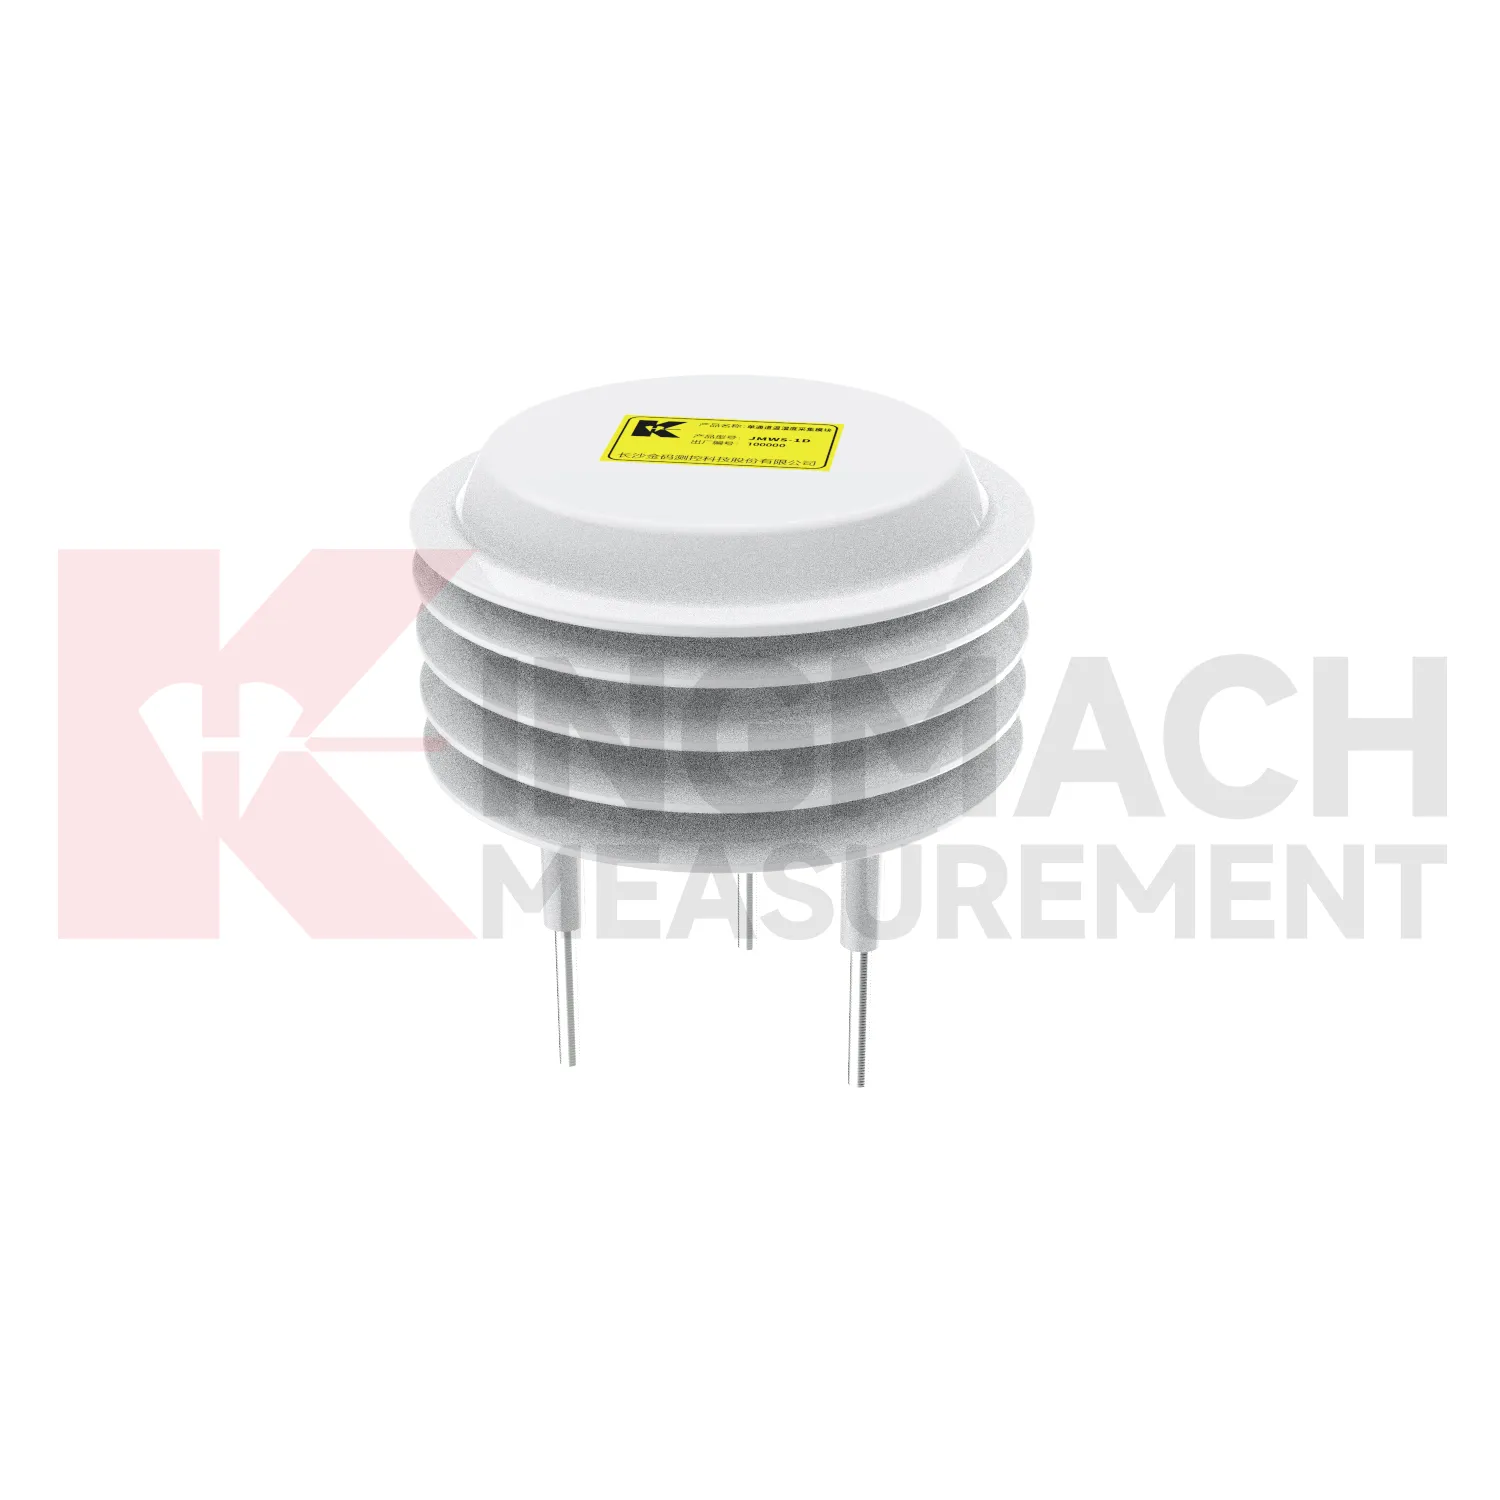
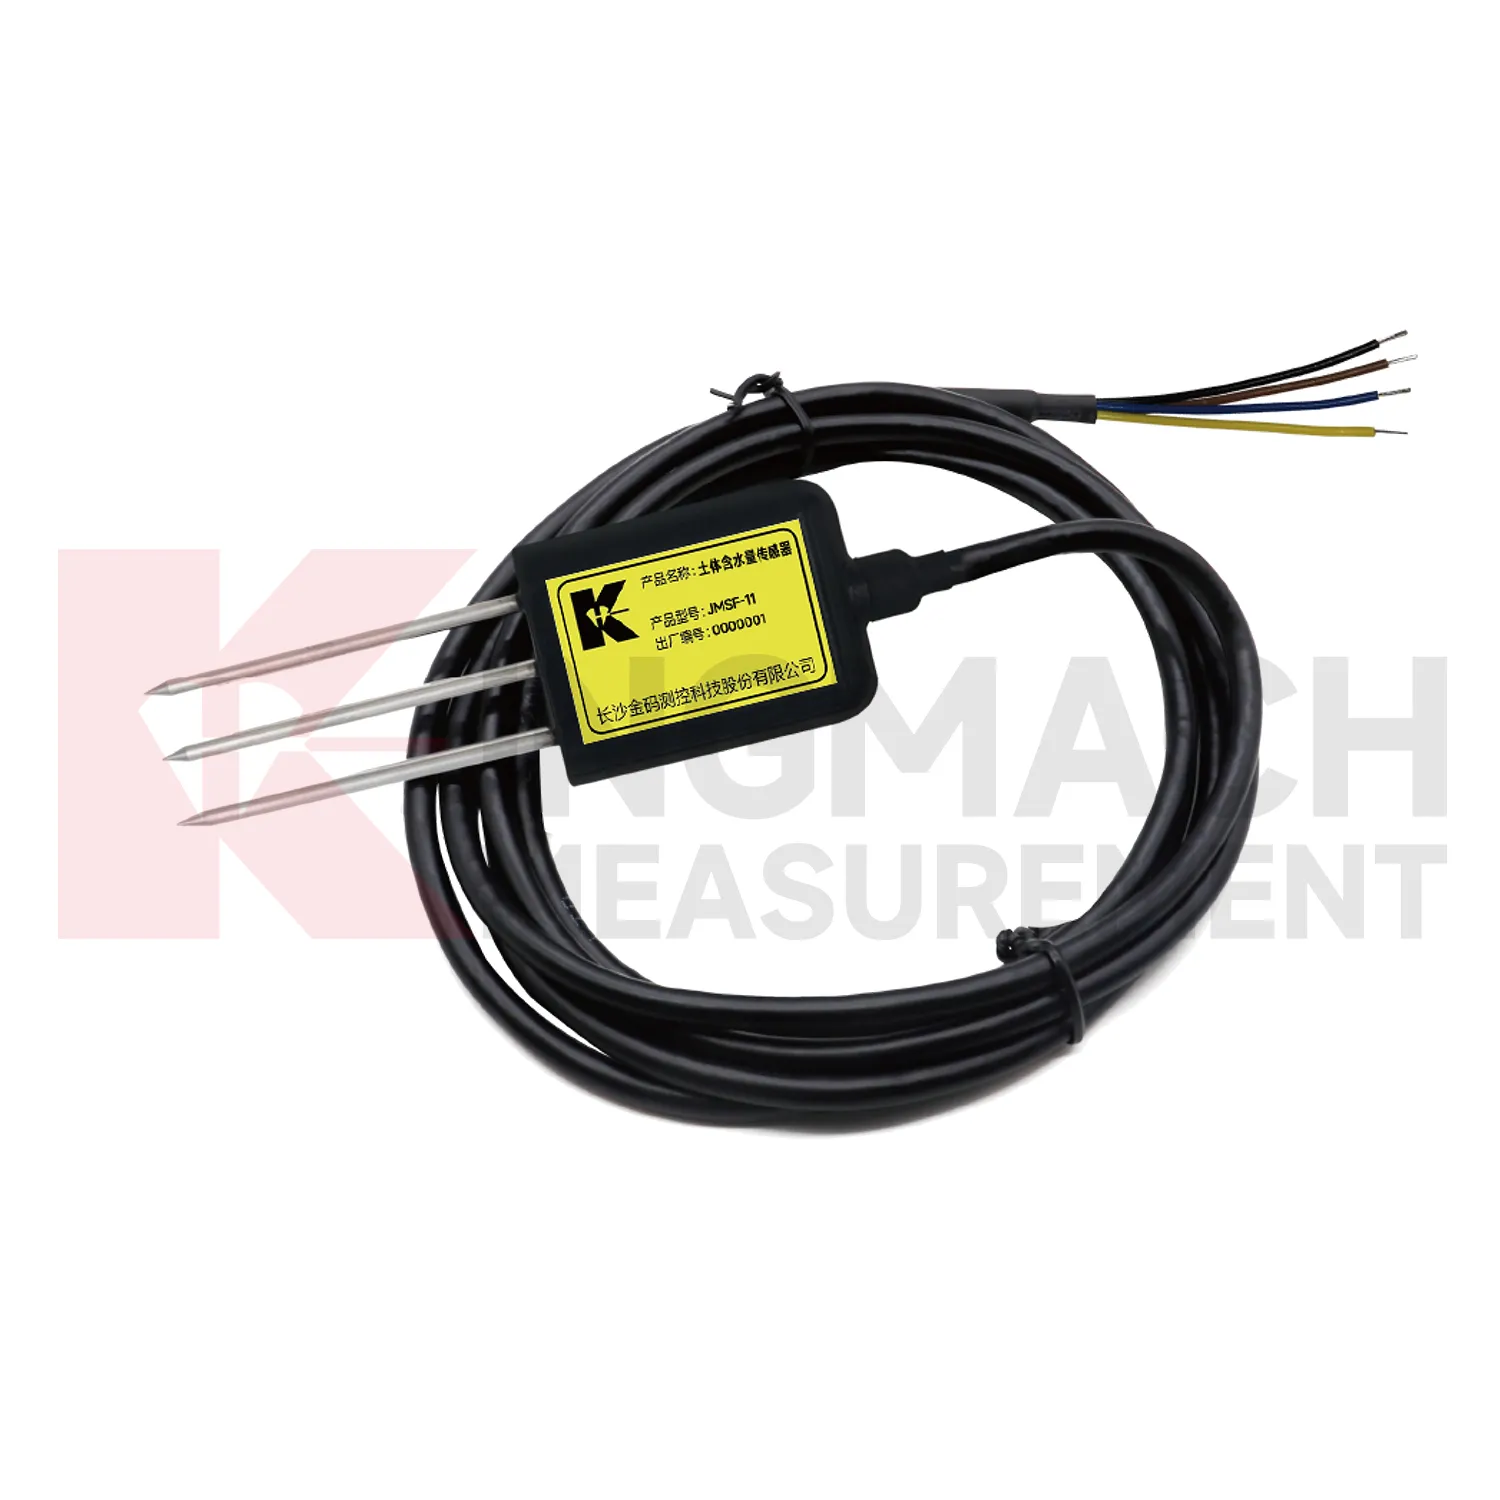
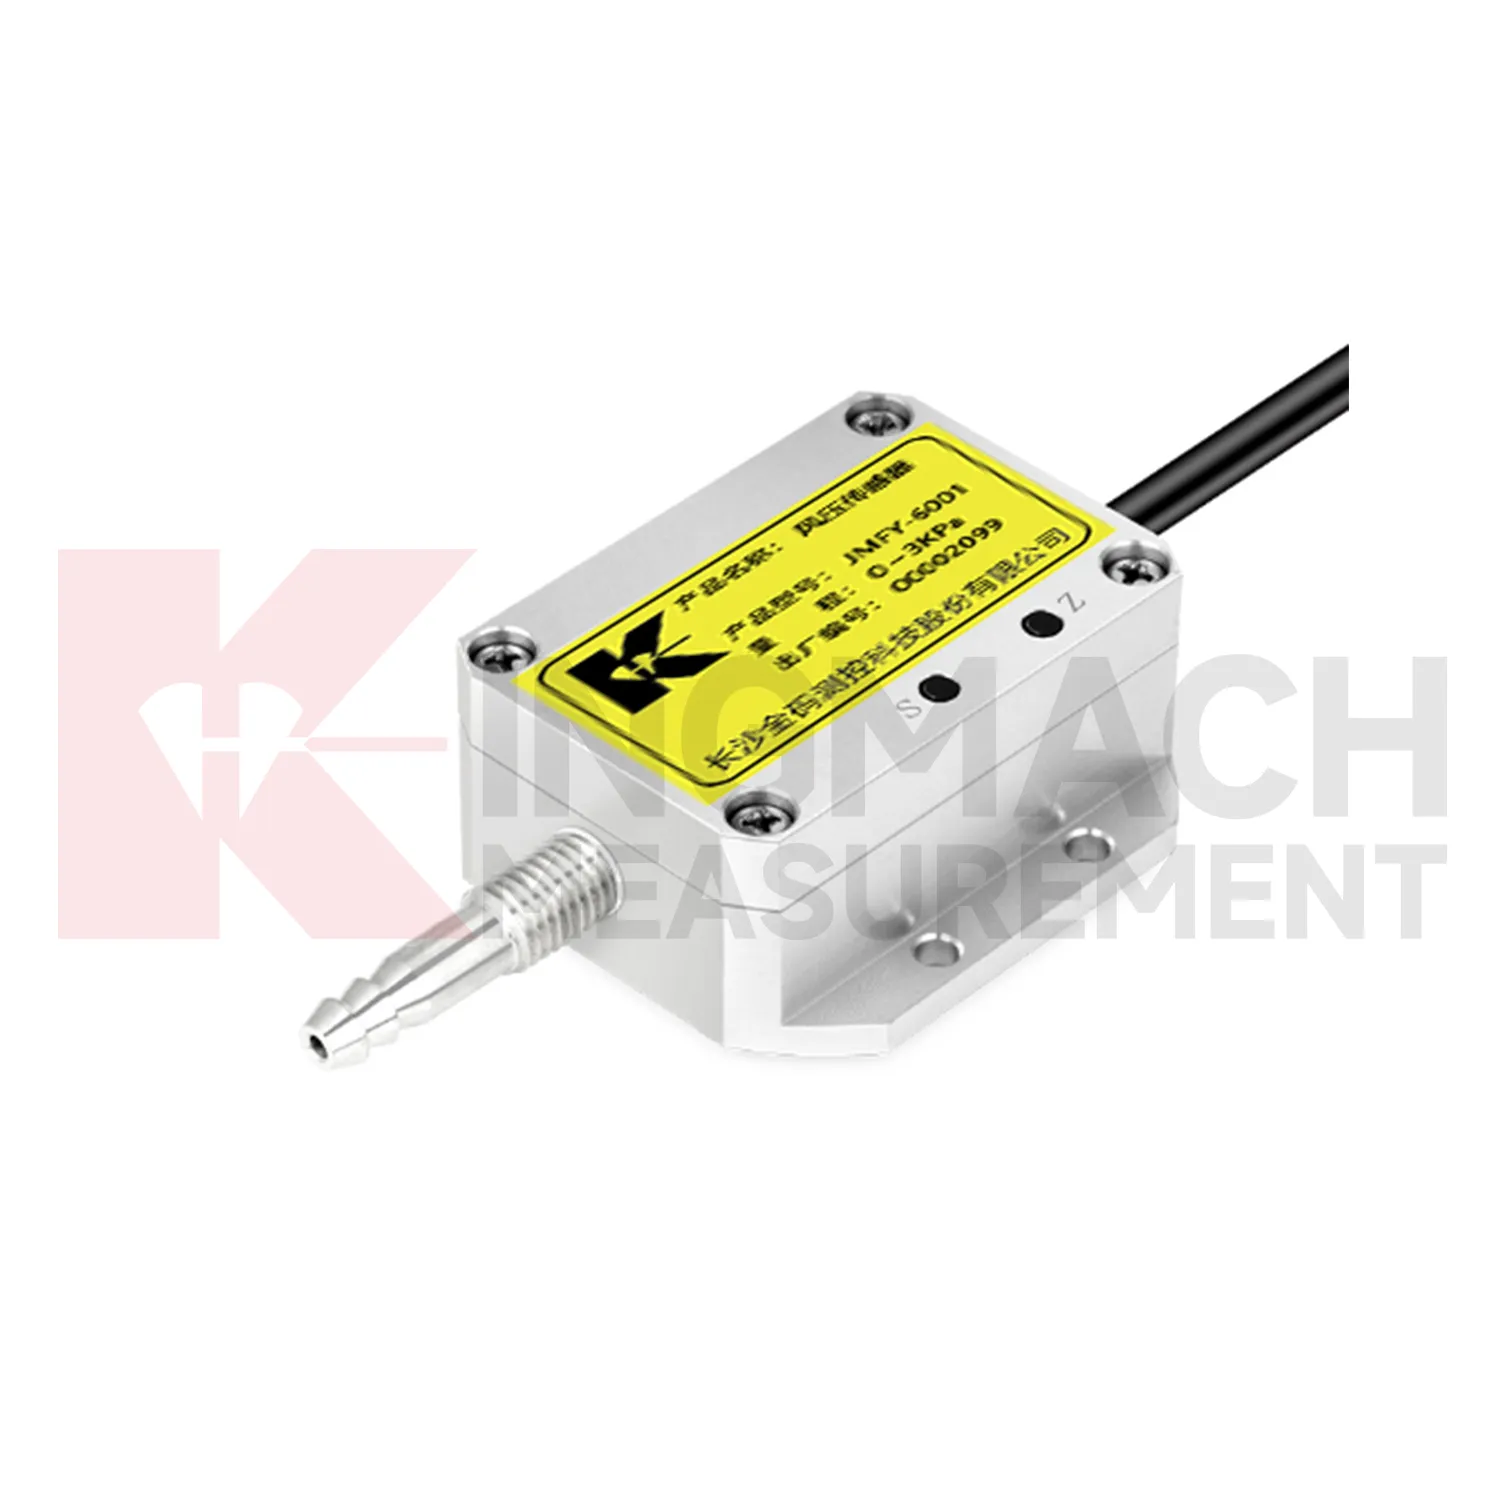
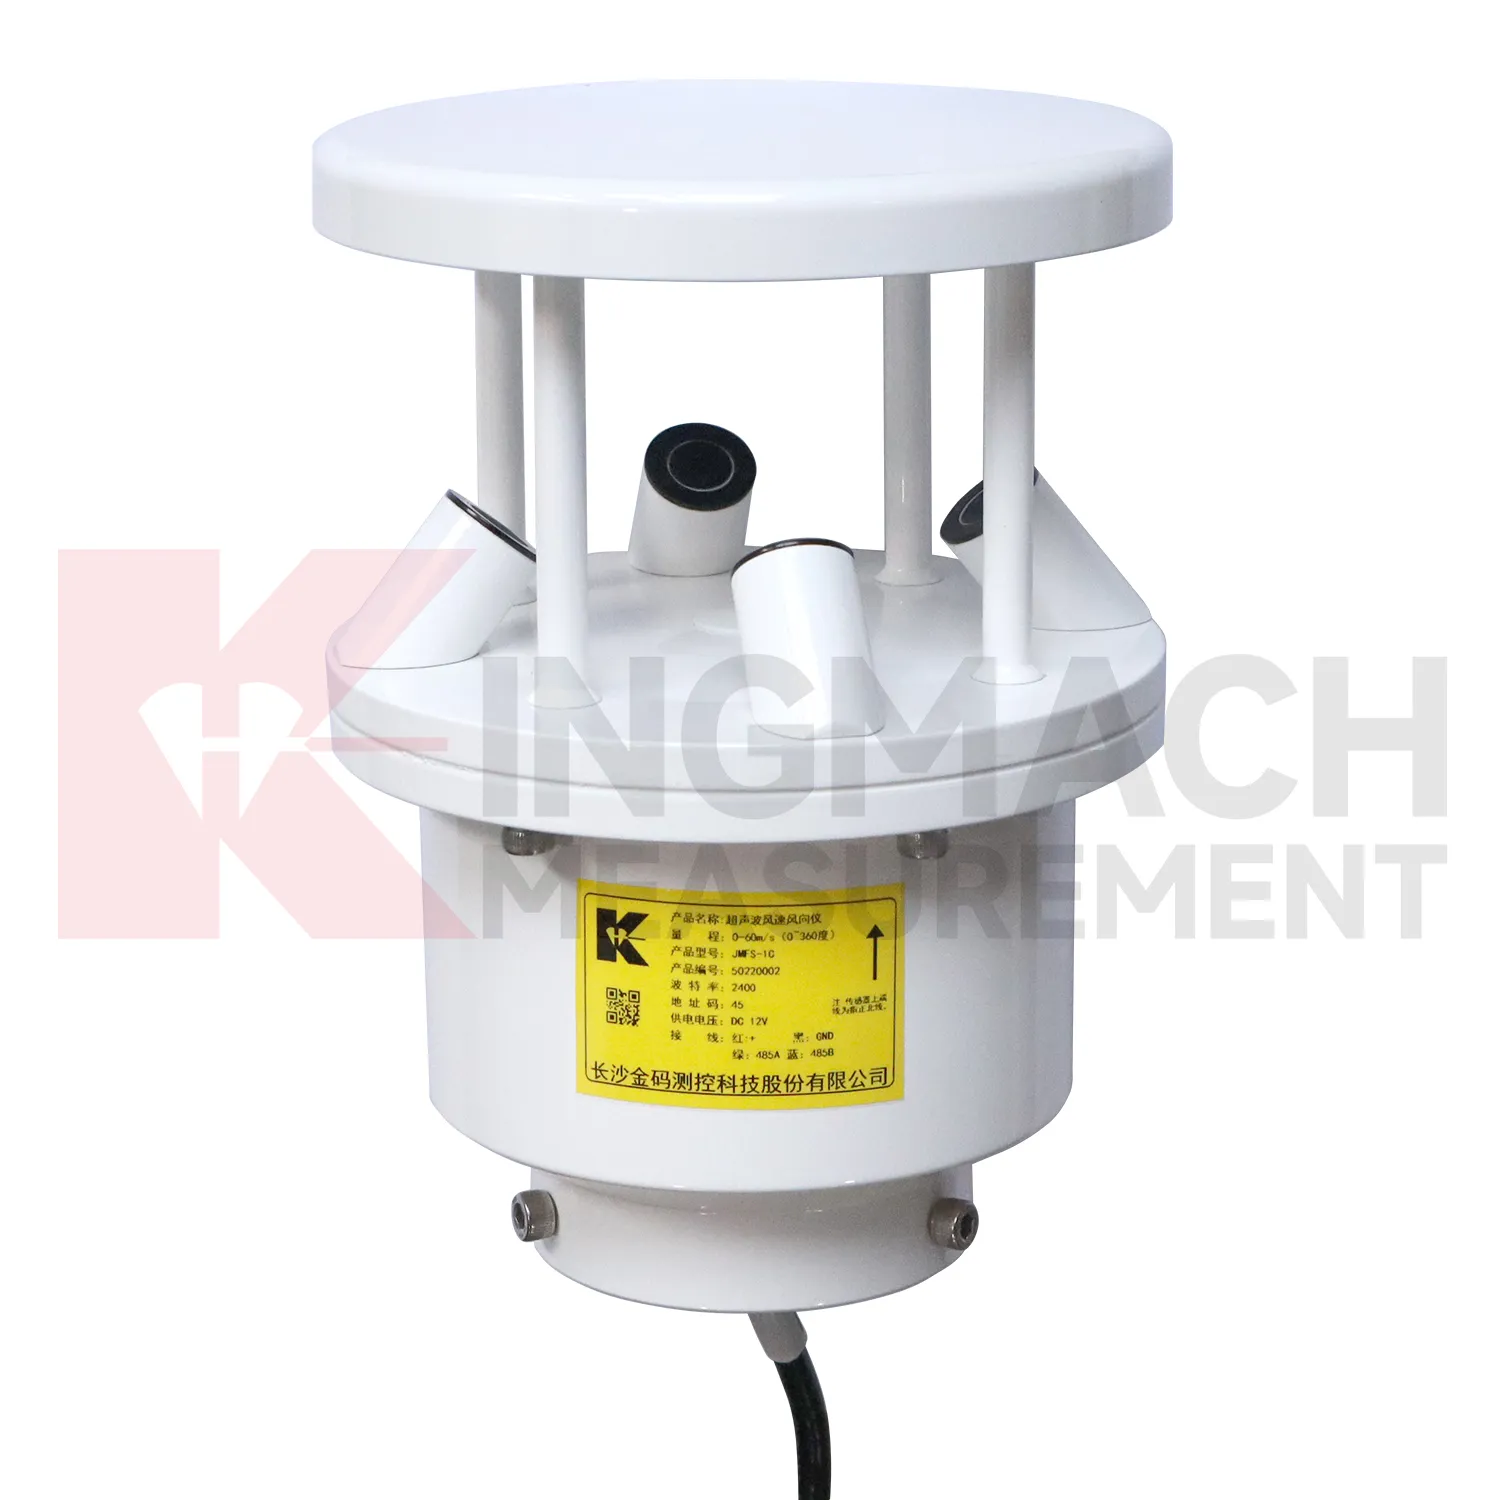
Kingmach Temperature Sensor covers the site-condition layer of structural and geotechnical monitoring. It records the environmental forces and operating conditions that often explain why a structural sensor changes. Rainfall can precede slope movement or seepage; soil wetness can show whether water has reached a sensitive layer; temperature can affect strain, expansion, and sensor behavior; humidity can reveal cabinet and tunnel risks; wind can explain vibration, pressure, and access constraints. A useful description of this category should therefore start with the monitoring problem. The equipment is not installed to fill a dashboard with weather values. It is installed so engineers can compare conditions with settlement, displacement, tilt, load, vibration, strain, inspection notes, and maintenance actions. When these records share time stamps and point names, the owner can see both the trigger and the response. That makes abnormal-event review faster and helps long-term reports distinguish seasonal patterns from real deterioration.
If the reading seems unusual, the team should check the physical condition of the station before drawing conclusions about the asset. Blockage, poor exposure, loose wiring, water entry, and changed surroundings can all create misleading patterns.
A practical report links the condition value with time, place, and action. It should help a reviewer decide whether to keep observing, inspect the field point, compare nearby instruments, or record the event as normal site behavior.
Application of Temperature Sensor
Dam and hydraulic projects use Kingmach Temperature Sensor to understand the environmental background behind seepage, slope movement, settlement, and inspection planning. Rainfall, soil wetness, temperature, and wind exposure can all influence how a dam site behaves. Environmental records should be reviewed with reservoir level, seepage flow, pore pressure, settlement, displacement, and inspection notes. A single storm may not create immediate movement, but repeated wetting may change the ground condition. Temperature cycles may also affect surface readings, equipment cabinets, and concrete behavior. Monitoring points should be placed where they support the dam-safety question, not merely where installation is easy. Over years, these records help teams distinguish seasonal patterns from new or localized changes that require closer review.
The installation file should explain why the location represents the monitored area. If the point is sheltered, shaded, exposed, buried, elevated, or placed inside an enclosure, that fact changes how later readings should be understood by maintenance staff.
During abnormal events, the first question is not only whether the value crossed a limit. The reviewer should ask what changed around the site, whether the related structure reacted, and whether a field inspection confirmed the same pattern.
Long-term value comes from consistency. A channel that keeps the same location, unit, maintenance history, and linked asset record can support seasonal comparison, post-storm review, and handover between construction and operation teams.
The future of Temperature Sensor
Future Kingmach Temperature Sensor will be grouped around engineering questions. A slope group may include rainfall, soil wetness, displacement, tilt, and pore pressure. A bridge group may include wind, temperature, strain, acceleration, and displacement. A tunnel group may include humidity, temperature, seepage, settlement, and convergence. This grouping is more useful than arranging channels only by sensor family. Owners review risks, not instrument categories. When dashboards and reports follow the risk, environmental data becomes easier for field teams to use during both routine review and abnormal events.
Maintenance teams should record cleaning, access difficulty, enclosure condition, cable repair, vegetation growth, nearby equipment changes, and the first normal reading after work. Those notes protect the meaning of the curve when old data is reviewed months later.
The environmental point should be part of a named monitoring question. It may explain wetting, drying, wind exposure, thermal movement, cabinet stress, or pressure variation, but that purpose needs to be visible in drawings and reports.
Care & Maintenance of Temperature Sensor
Care and maintenance of Kingmach Temperature Sensor should begin with placement checks. A station can be technically healthy and still produce poor data if it is installed in the wrong place. Rain points need open sky and level mounting. Wind points need representative airflow. Soil points need firm contact at the intended depth. Humidity points need to reflect the room, tunnel, cabinet, or work zone being monitored. Pressure points need clean and sealed paths. Maintenance staff should record location, mounting height, exposure, cable route, and any nearby site change. If a wall, roof, new machine, temporary shelter, or excavation appears near the point, the data may change even though the sensor has not failed.
During abnormal events, the first question is not only whether the value crossed a limit. The reviewer should ask what changed around the site, whether the related structure reacted, and whether a field inspection confirmed the same pattern.
Long-term value comes from consistency. A channel that keeps the same location, unit, maintenance history, and linked asset record can support seasonal comparison, post-storm review, and handover between construction and operation teams.
Kingmach Temperature Sensor
A Kingmach Temperature Sensor station should be planned as a small field system. The rain point needs open exposure and level installation. The wind point needs representative airflow rather than shelter behind a wall. A soil probe needs firm contact at a meaningful depth. A humidity point needs to represent the room, tunnel, cabinet, or work zone being monitored. Power, cables, connectors, enclosure protection, and communication channels matter because poor field setup can create misleading records. The station drawing should show where each condition is measured and why that position was chosen. This makes later review easier when the site changes, a cabinet is moved, or a reading no longer matches surrounding conditions.
Long-term value comes from consistency. A channel that keeps the same location, unit, maintenance history, and linked asset record can support seasonal comparison, post-storm review, and handover between construction and operation teams.
Maintenance teams should record cleaning, access difficulty, enclosure condition, cable repair, vegetation growth, nearby equipment changes, and the first normal reading after work. Those notes protect the meaning of the curve when old data is reviewed months later.
FAQ
Q: Can environmental data support asset management?
A: Yes. Long-term records help owners compare weather, exposure, maintenance events, and structural response across seasons and assets.
Q: How does it help during alarms?
A: It lets reviewers check whether a structural alarm followed rain, wind, temperature change, humidity rise, or another site condition.
Q: What should dashboards show?
A: Dashboards should link environmental channels to the structural risks they explain, rather than displaying unrelated values together.
Q: Why avoid product-list writing?
A: Readers need to understand monitoring purpose and field value; long product lists make the page harder to use and less natural.
Q: What is the best review habit?
A: Review environmental data with time-aligned structural readings, inspection notes, maintenance records, and the site event that triggered concern.
If the reading seems unusual, the team should check the physical condition of the station before drawing conclusions about the asset. Blockage, poor exposure, loose wiring, water entry, and changed surroundings can all create misleading patterns.
Reviews
Andrew Lee
The visualization software is intuitive and powerful. It helps us analyze monitoring data efficiently.
David Wilson
We purchased displacement transducers and settlement sensors, and the quality exceeded our expectations. Easy installation and reliable performance.
Latest Inquiries
To protect the privacy of our buyers, only public service email domains like Gmail, Yahoo, and MSN will be displayed. Additionally, only a limited portion of the inquiry content will be shown.
Ava***@gmail.comAustralia
Hi, I am looking for reliable tiltmeters and accelerometers for structural health monitoring. Please...
Amelia***@gmail.comSingapore
Hello, I am looking for visualization software for monitoring system data analysis. Please let me kn...
Related product categories
- wind direction and speed sensor
- wind speed and direction sensors
- tipping bucket rain gauge
- tipping bucket rain gauge resolution 0.2 mm standard
- tipping bucket rain gauges
- tipping bucket rain gauge resolution 0.1 mm 0.2 mm standard
- tipping bucket rain gauge resolution 0.1 mm standard
- rain gauge tipping bucket
- tipping bucket rain gauge sensor
- tipping bucket type rain gauge
- tipping rain bucket gauge
- tipping bucket rain gauge 0.2 mm per tip standard