 ar
ar bg
bg hr
hr cs
cs da
da nl
nl fi
fi fr
fr de
de el
el hi
hi it
it ko
ko no
no pl
pl pt
pt ro
ro ru
ru es
es sv
sv tl
tl iw
iw id
id lv
lv lt
lt sr
sr sk
sk sl
sl uk
uk vi
vi et
et hu
hu th
th tr
tr fa
fa ms
ms hy
hy ka
ka ur
ur bn
bn mn
mn ta
ta kk
kk uz
uz ku
ku
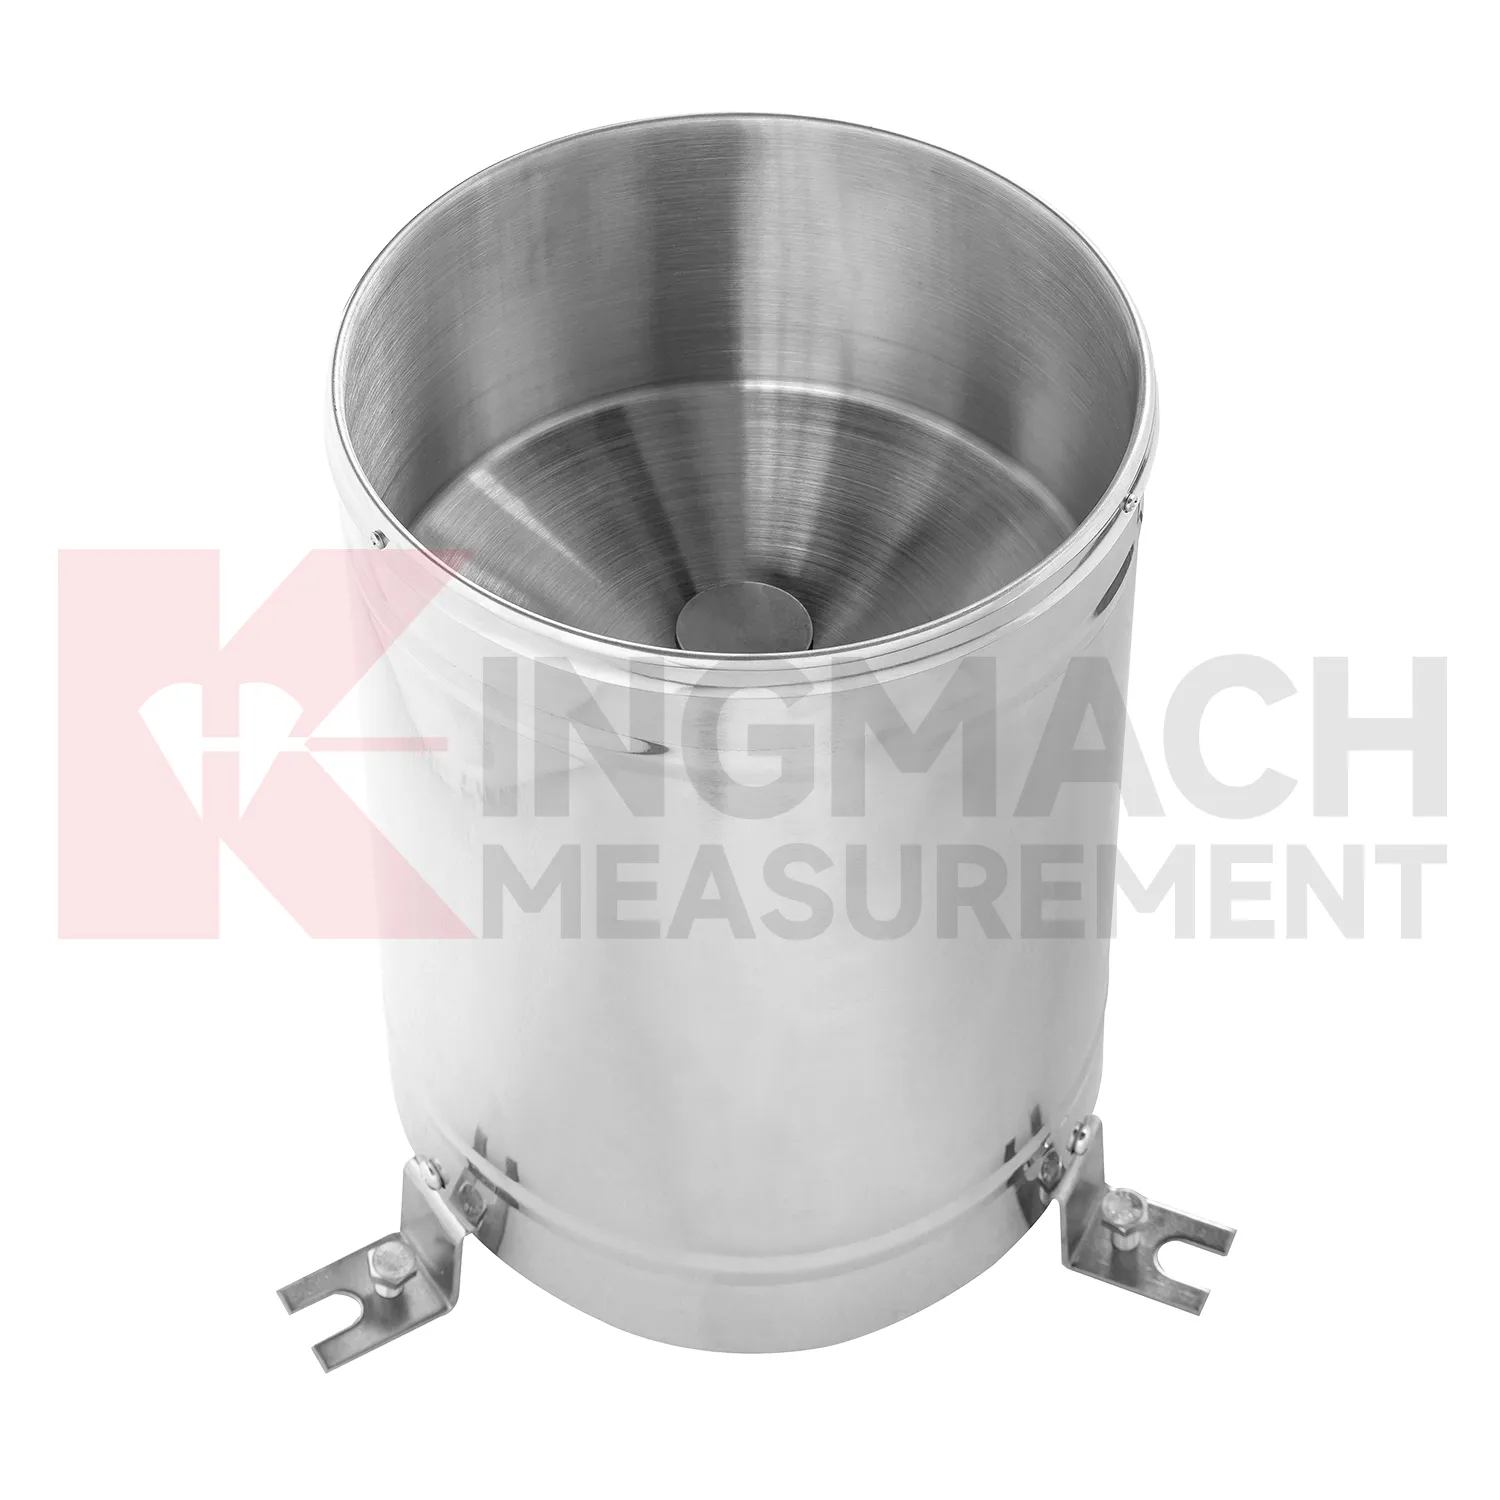
tipping bucket rain gauge data logger
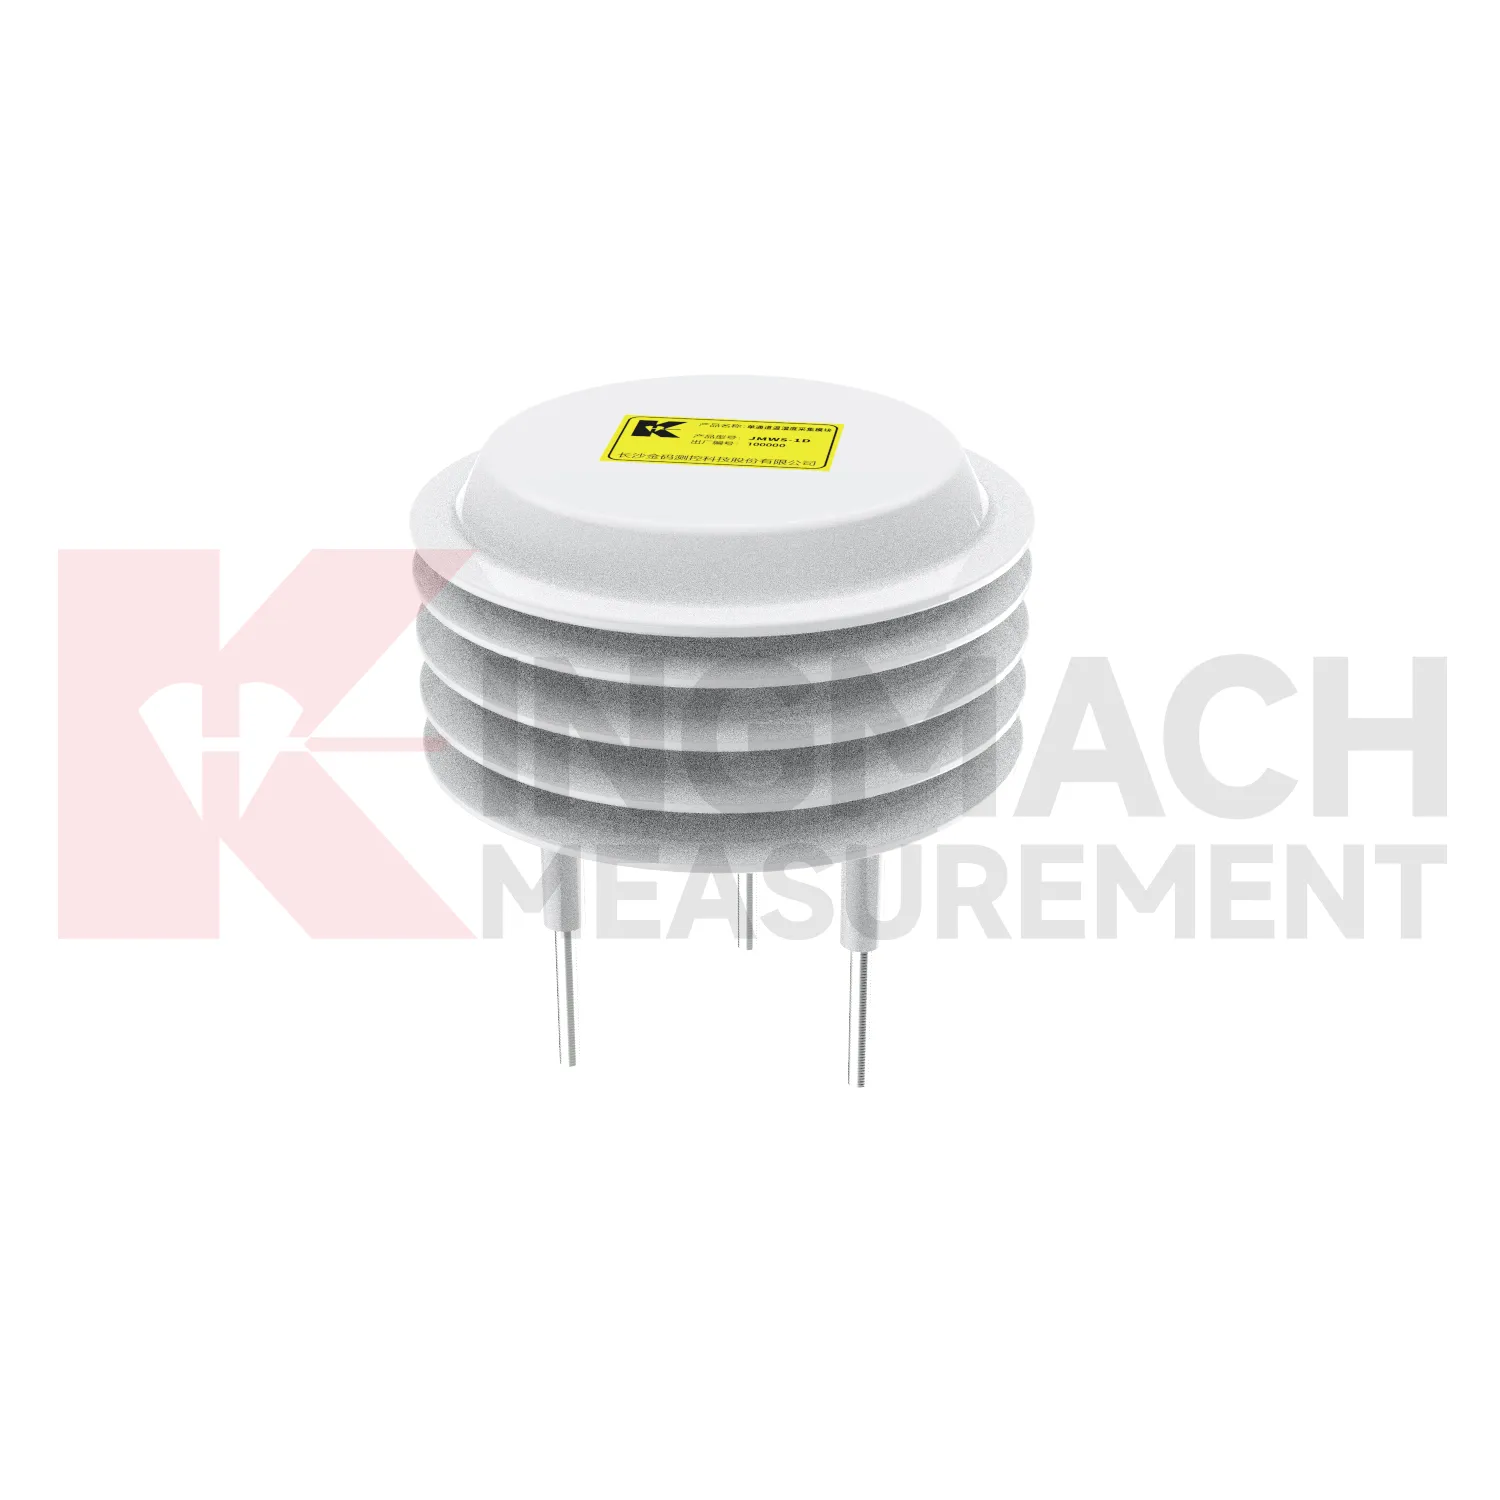
Kingmach tipping bucket rain gauge data logger covers the site-condition layer of structural and geotechnical monitoring. It records the environmental forces and operating conditions that often explain why a structural sensor changes. Rainfall can precede slope movement or seepage; soil wetness can show whether water has reached a sensitive layer; temperature can affect strain, expansion, and sensor behavior; humidity can reveal cabinet and tunnel risks; wind can explain vibration, pressure, and access constraints. A useful description of this category should therefore start with the monitoring problem. The equipment is not installed to fill a dashboard with weather values. It is installed so engineers can compare conditions with settlement, displacement, tilt, load, vibration, strain, inspection notes, and maintenance actions. When these records share time stamps and point names, the owner can see both the trigger and the response. That makes abnormal-event review faster and helps long-term reports distinguish seasonal patterns from real deterioration.
If the reading seems unusual, the team should check the physical condition of the station before drawing conclusions about the asset. Blockage, poor exposure, loose wiring, water entry, and changed surroundings can all create misleading patterns.
A practical report links the condition value with time, place, and action. It should help a reviewer decide whether to keep observing, inspect the field point, compare nearby instruments, or record the event as normal site behavior.
Application of tipping bucket rain gauge data logger
Geotechnical engineering uses Kingmach tipping bucket rain gauge data logger to explain how water and weather affect ground behavior. Soil wetness, rainfall, temperature, and humidity can influence slopes, embankments, foundation pits, tunnel portals, retaining walls, and reclamation areas. Environmental data should be reviewed with inclinometers, settlement sensors, displacement meters, pore-pressure records, and field inspections. A deformation curve during dry weather may suggest a different cause than a curve following repeated rainfall and rising soil wetness. Engineers also need to know whether construction work, loading, drainage changes, or excavation occurred during the same period. Environmental monitoring gives the missing condition layer, helping the team move from “the ground moved” to a more useful question: what changed around the ground before it moved?
If the reading seems unusual, the team should check the physical condition of the station before drawing conclusions about the asset. Blockage, poor exposure, loose wiring, water entry, and changed surroundings can all create misleading patterns.
A practical report links the condition value with time, place, and action. It should help a reviewer decide whether to keep observing, inspect the field point, compare nearby instruments, or record the event as normal site behavior.
For owners, the strongest record is the one that remains understandable after staff changes. Clear units, plain point names, installation photos, maintenance notes, and linked structural channels make the data usable beyond the original project team.
The future of tipping bucket rain gauge data logger
Future Kingmach tipping bucket rain gauge data logger reporting will make abnormal-event review more traceable. A report that says a slope moved after rain should show rainfall timing, wetting response, movement rate, and inspection results together. A report that says bridge vibration rose during wind should show wind direction, wind period, structural response, and related maintenance notes. This reduces manual work and makes reports easier to defend. Environmental records should follow the same naming and time standards as structural records. When the reporting workflow is consistent, owners can compare events across seasons, assets, and maintenance teams.
The next step is report structure that follows the event, not the instrument list. A storm report should gather rain, wetting, seepage, ground movement, photographs, and field actions. A heat-related report should gather temperature, strain behavior, expansion observations, and cabinet status. This makes the document easier for owners, designers, and field crews to review together.
Traceable reporting also protects future decisions. If the same asset produces another alarm years later, the team can compare event type, measured condition, inspection result, and repair action without rebuilding the story from scattered files. That continuity is often more useful than a single high-resolution curve.
Care & Maintenance of tipping bucket rain gauge data logger
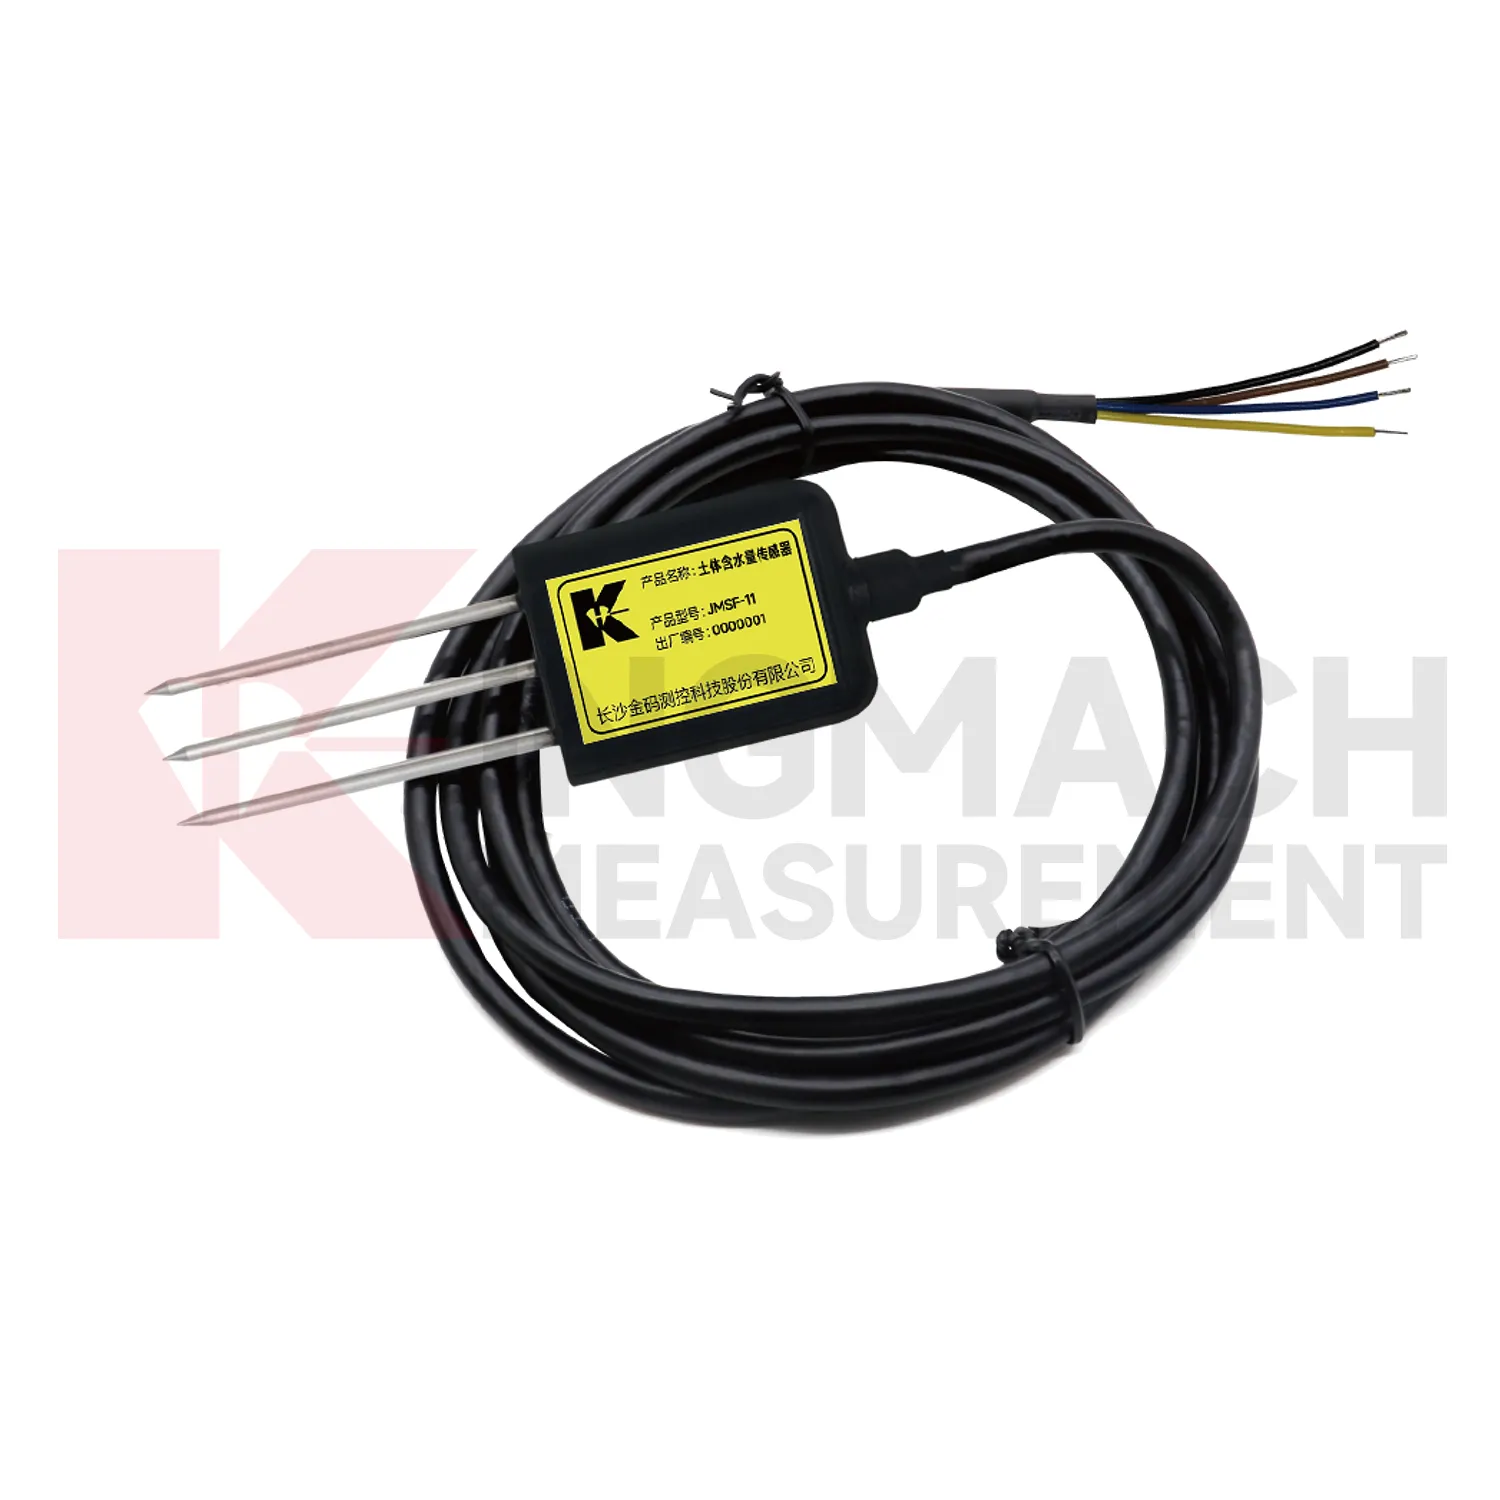
Soil-condition maintenance for Kingmach tipping bucket rain gauge data logger should protect the contact between the buried point and the surrounding material. Air gaps, disturbed soil, cable damage, excavation, animal activity, or water paths along the cable can all affect readings. Installation records should include depth, soil type, location photo, cable route, and first stable value. During review, compare soil wetness with rainfall, irrigation, groundwater, and nearby deformation. If a buried channel becomes flat or jumps suddenly, inspect cable continuity and recent site work before treating it as a real soil change. Buried points are easy to forget, so their maintenance history must be visible in the project file.
If the reading seems unusual, the team should check the physical condition of the station before drawing conclusions about the asset. Blockage, poor exposure, loose wiring, water entry, and changed surroundings can all create misleading patterns.
A practical report links the condition value with time, place, and action. It should help a reviewer decide whether to keep observing, inspect the field point, compare nearby instruments, or record the event as normal site behavior.
Kingmach tipping bucket rain gauge data logger
Rainfall records are a central part of Kingmach tipping bucket rain gauge data logger for slopes, embankments, dams, tunnel portals, and construction sites. Rain does not always cause immediate movement; water may enter the ground, raise pore pressure, soften material, or change runoff over time. That delay is exactly why a dated rainfall record matters. Engineers can compare the storm start, rainfall duration, peak intensity, soil response, and movement curve. Without that record, a slope alarm may be discussed as a vague weather event. With it, the team can see whether movement followed the storm, whether it continued after rain stopped, and whether field inspection is needed. Rain data becomes part of the engineering timeline rather than a background note.
The environmental point should be part of a named monitoring question. It may explain wetting, drying, wind exposure, thermal movement, cabinet stress, or pressure variation, but that purpose needs to be visible in drawings and reports.
If the reading seems unusual, the team should check the physical condition of the station before drawing conclusions about the asset. Blockage, poor exposure, loose wiring, water entry, and changed surroundings can all create misleading patterns.
FAQ
Q: Where should a rain point be placed?
A: It should be level, open to the sky, and away from obstructions, splash sources, roof edges, and debris-prone areas.
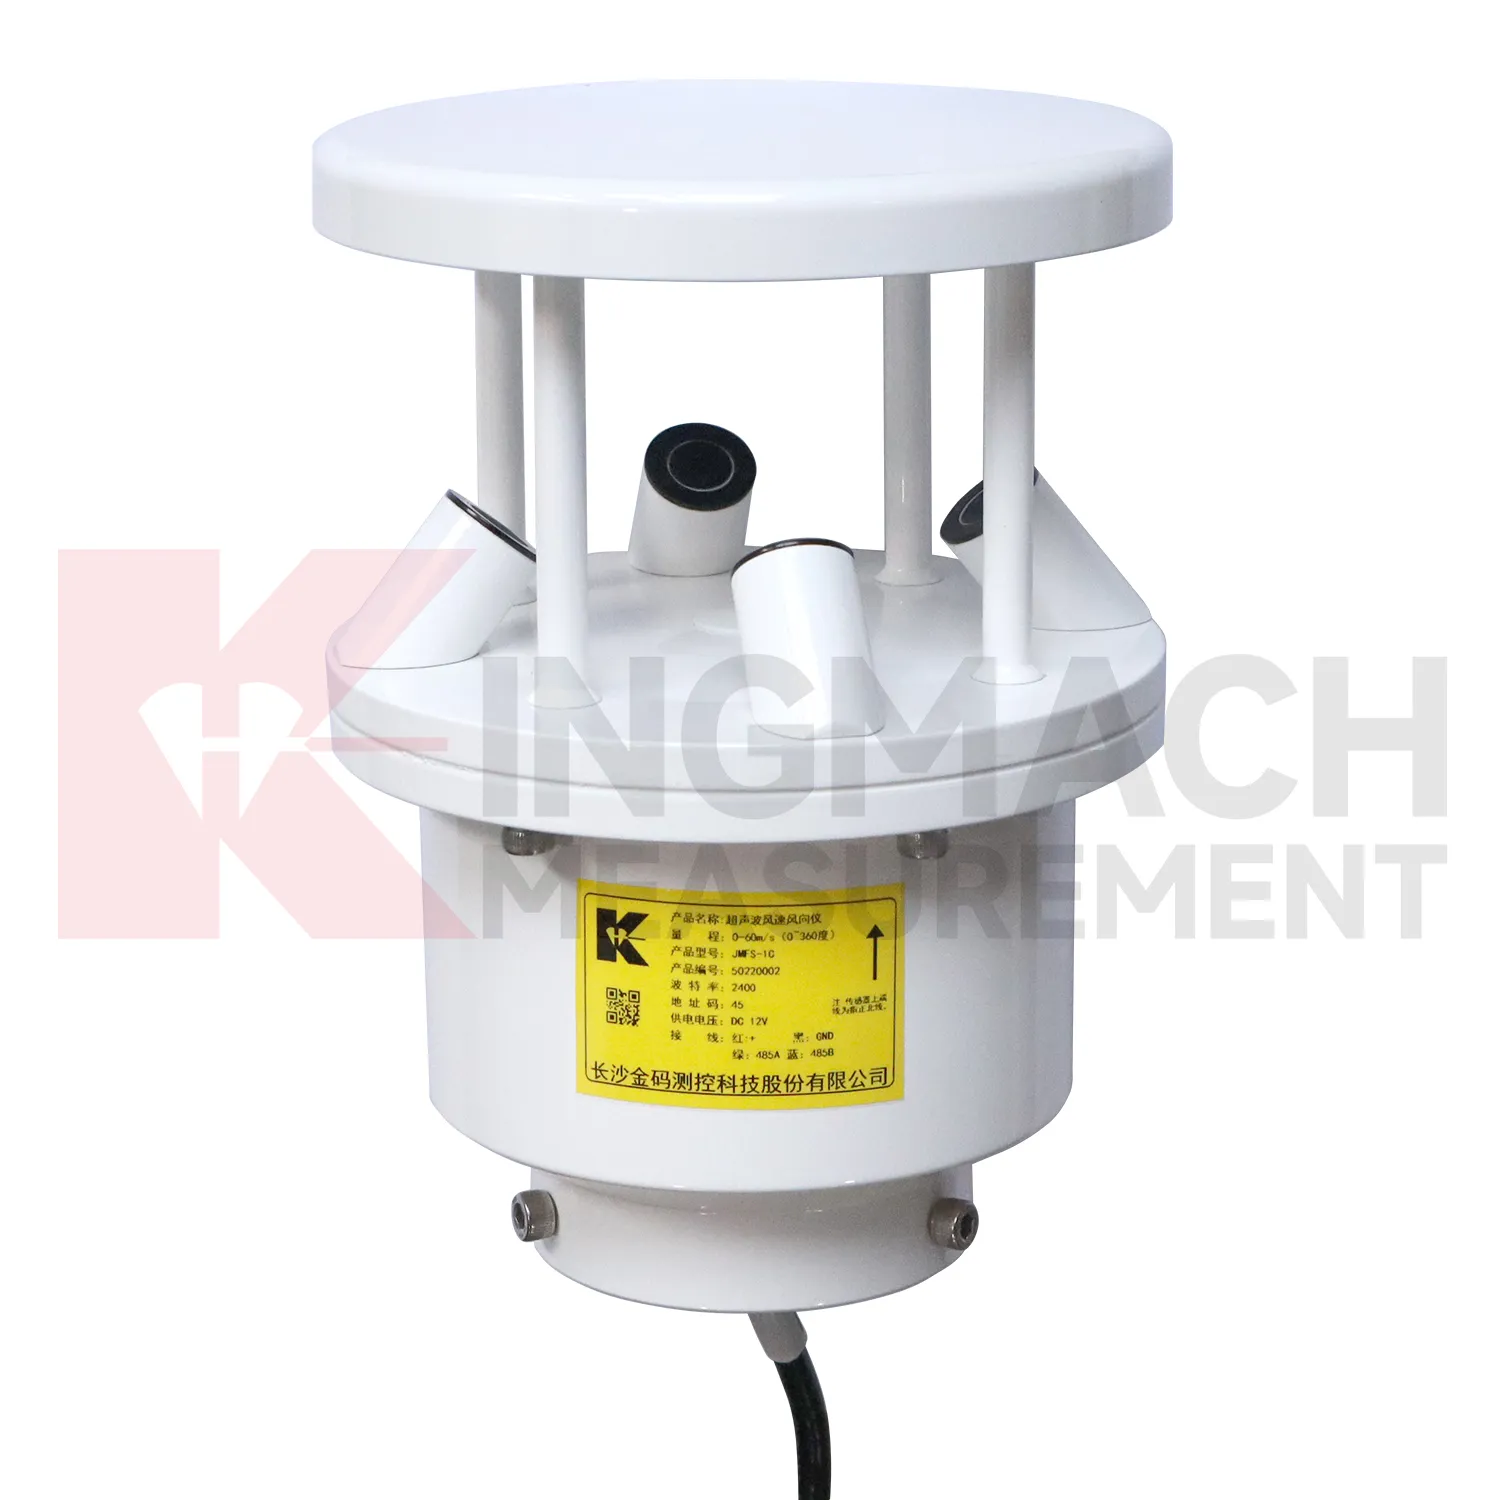
Q: Where should wind be measured?
A: Wind should be measured where airflow represents the asset or work area being reviewed, not behind a wall or sheltered obstruction.
Q: How should soil points be installed?
A: They should have firm contact with the surrounding soil, a recorded depth, protected cable route, and a stable first value.
Q: What should commissioning records include?
A: Include point location, measured condition, unit, mounting photo, cable route, power source, data channel, and linked structural record.
Q: Why are photos useful?
A: Photos help future reviewers understand exposure, mounting, cable routing, and whether later site changes affected readings.
Maintenance teams should record cleaning, access difficulty, enclosure condition, cable repair, vegetation growth, nearby equipment changes, and the first normal reading after work. Those notes protect the meaning of the curve when old data is reviewed months later.
Reviews
David Wilson
We purchased displacement transducers and settlement sensors, and the quality exceeded our expectations. Easy installation and reliable performance.
James Thompson
The tiltmeters and accelerometers are very sensitive and provide precise data. Perfect for our structural health monitoring system.
Latest Inquiries
To protect the privacy of our buyers, only public service email domains like Gmail, Yahoo, and MSN will be displayed. Additionally, only a limited portion of the inquiry content will be shown.
Olivia***@gmail.comUnited States
Hello, we are currently sourcing high-precision strain gauges and load cells for a bridge monitoring...
Isabella***@gmail.comGermany
Hello, we are evaluating weir flow meters for a water management project. Please share accuracy deta...
Related product categories
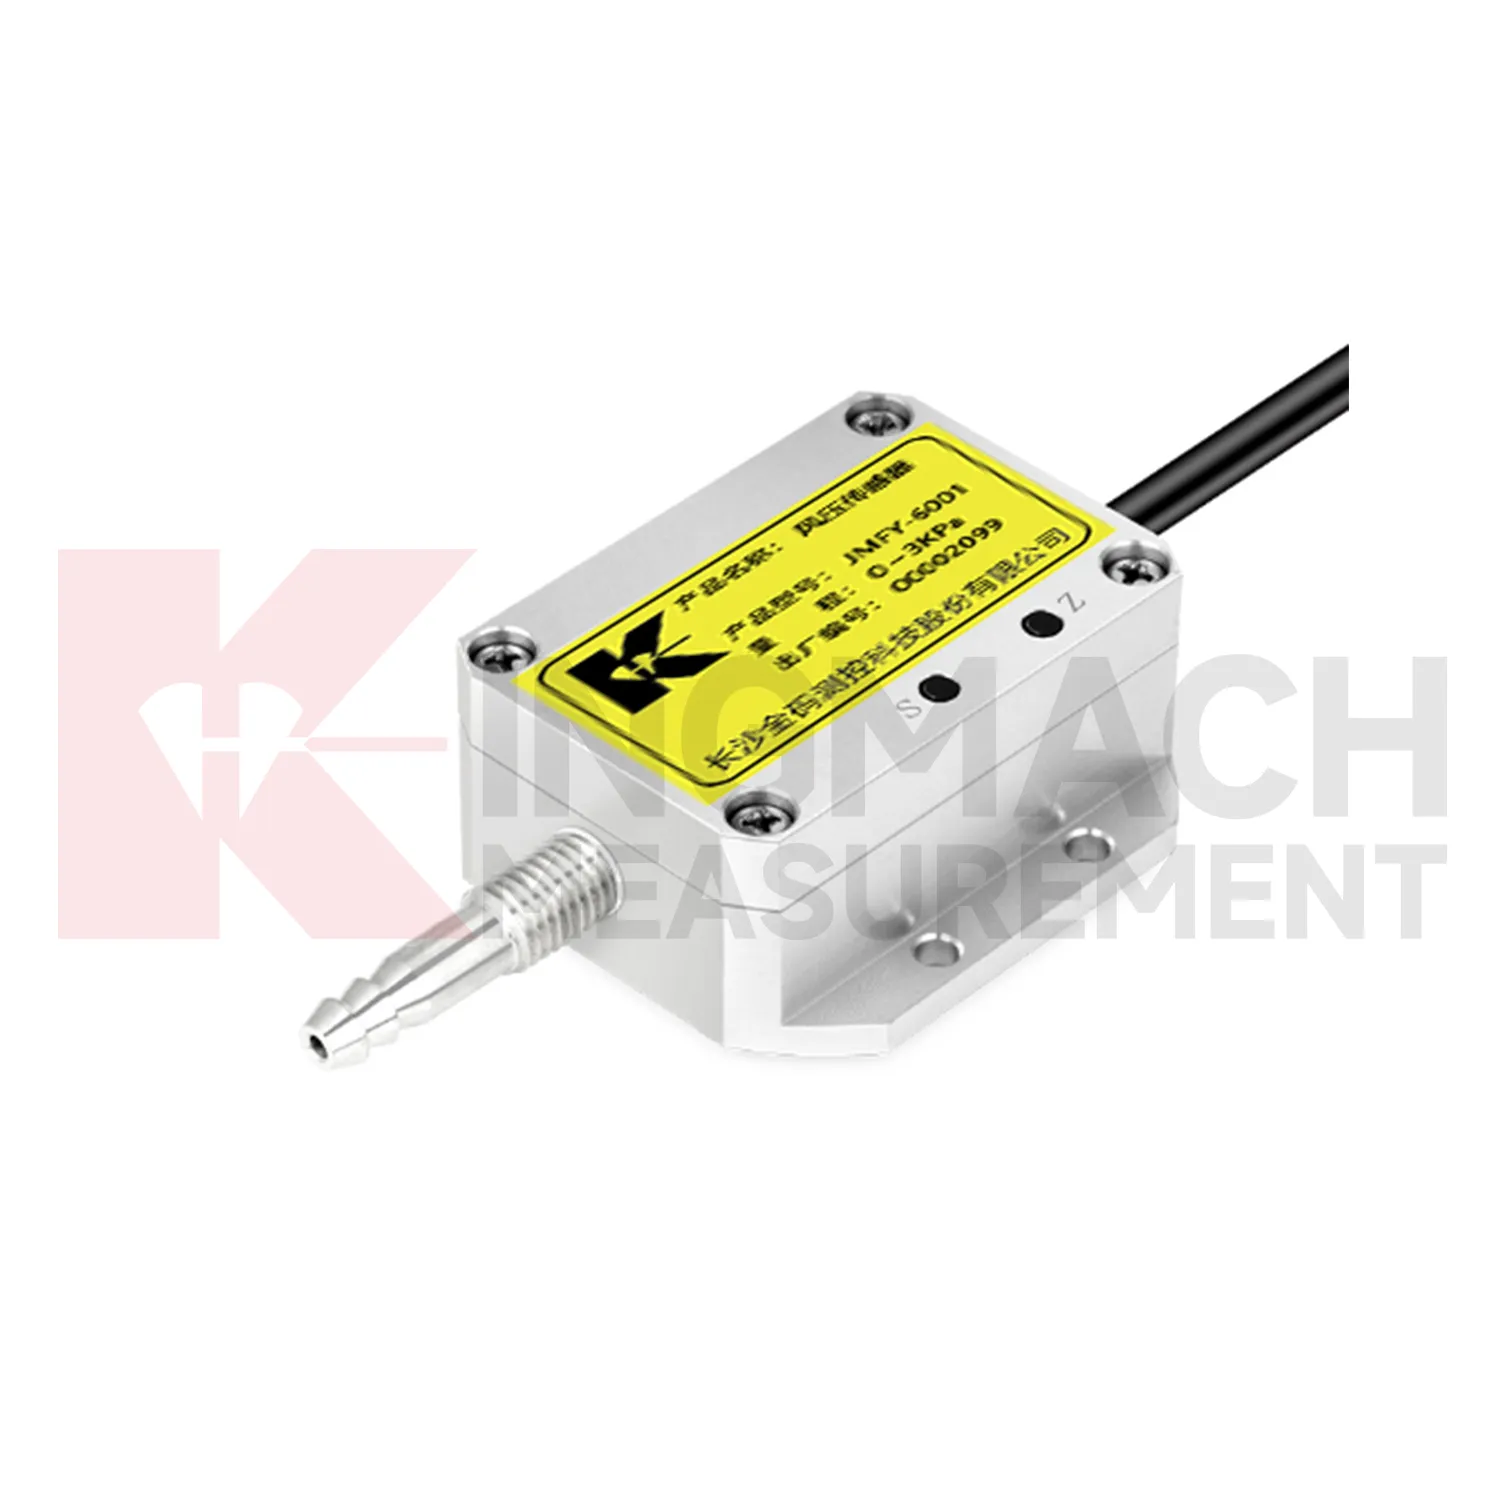
- wind pressure sensor
- ultrasonic wind speed and direction sensor
- wind speed and direction sensor
- wind speed and wind direction sensor
- wind speed and direct sensor
- wireless wind speed and direction sensor
- wind direction and speed sensor
- wind speed and direction sensors
- tipping bucket rain gauge
- tipping bucket rain gauge resolution 0.2 mm standard
- tipping bucket rain gauges
- tipping bucket rain gauge resolution 0.1 mm 0.2 mm standard